Biodiversity Monitoring Dashboard
Empowering Stakeholders to Track Ecological Recovery with eDNA Analytics
I partnered with the International Barcode of Life Consortium to help a natural resource company monitor biodiversity impact across their sites using eDNA. The data was rich with thousands of species records and ecological indicators, but difficult for stakeholders to interpret or use in decision-making. They needed a clear way to compare remediation sites with healthy reference forest and understand how ecosystems were recovering over time.
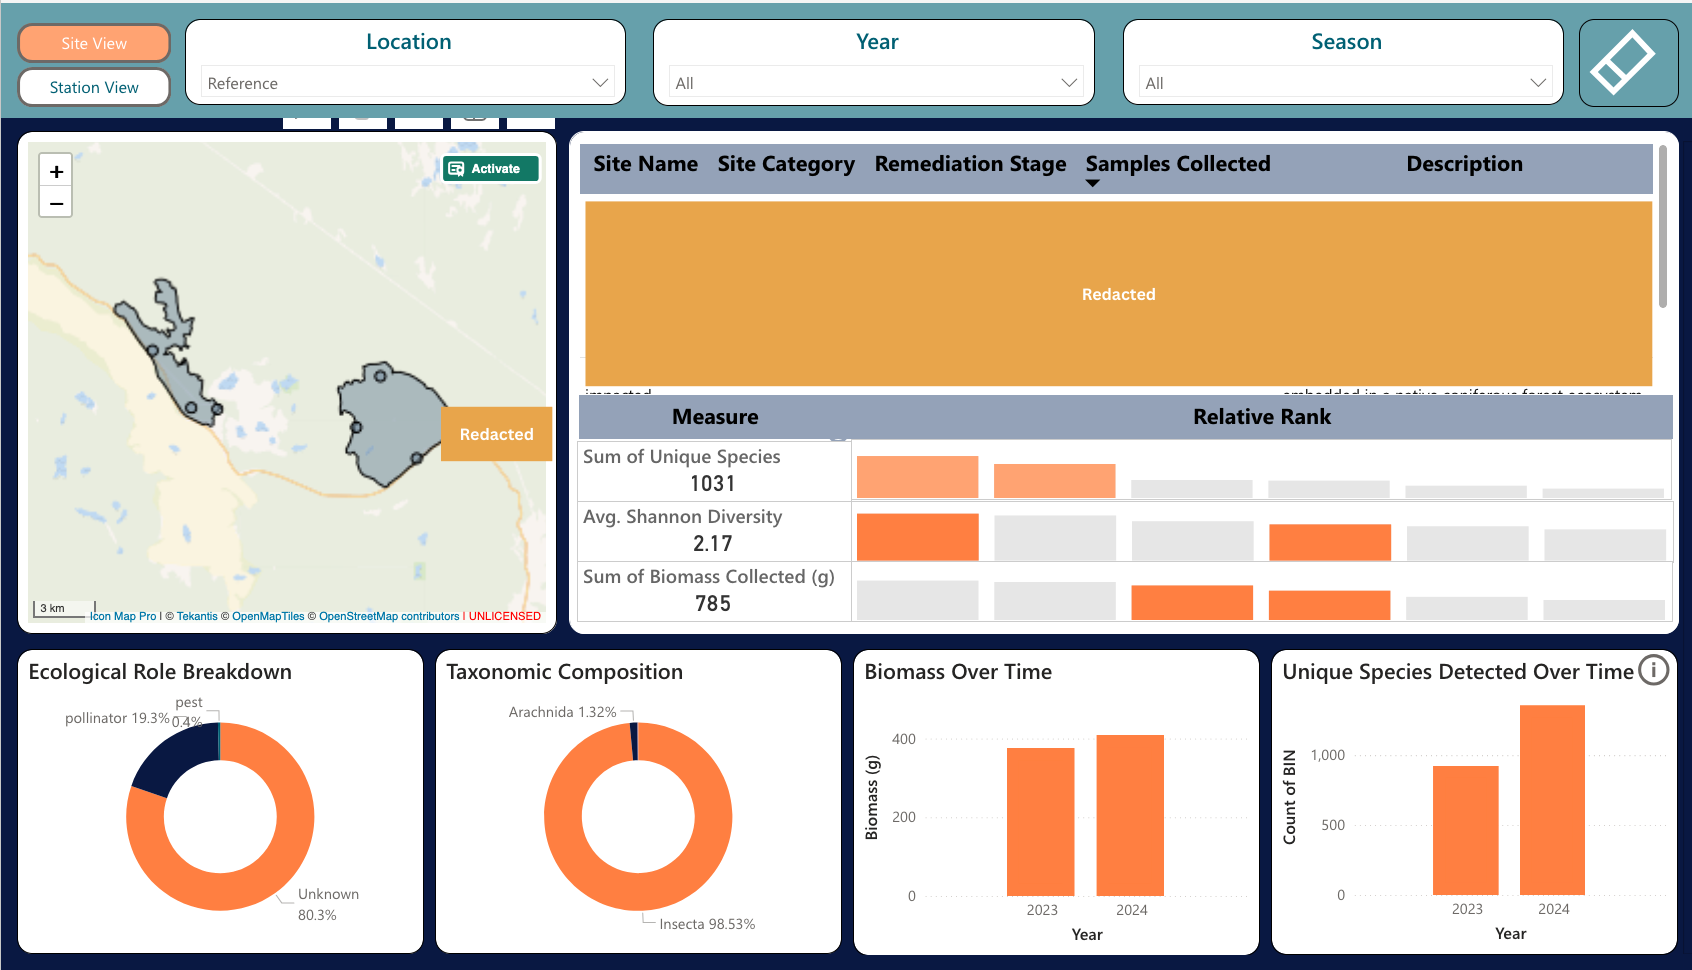
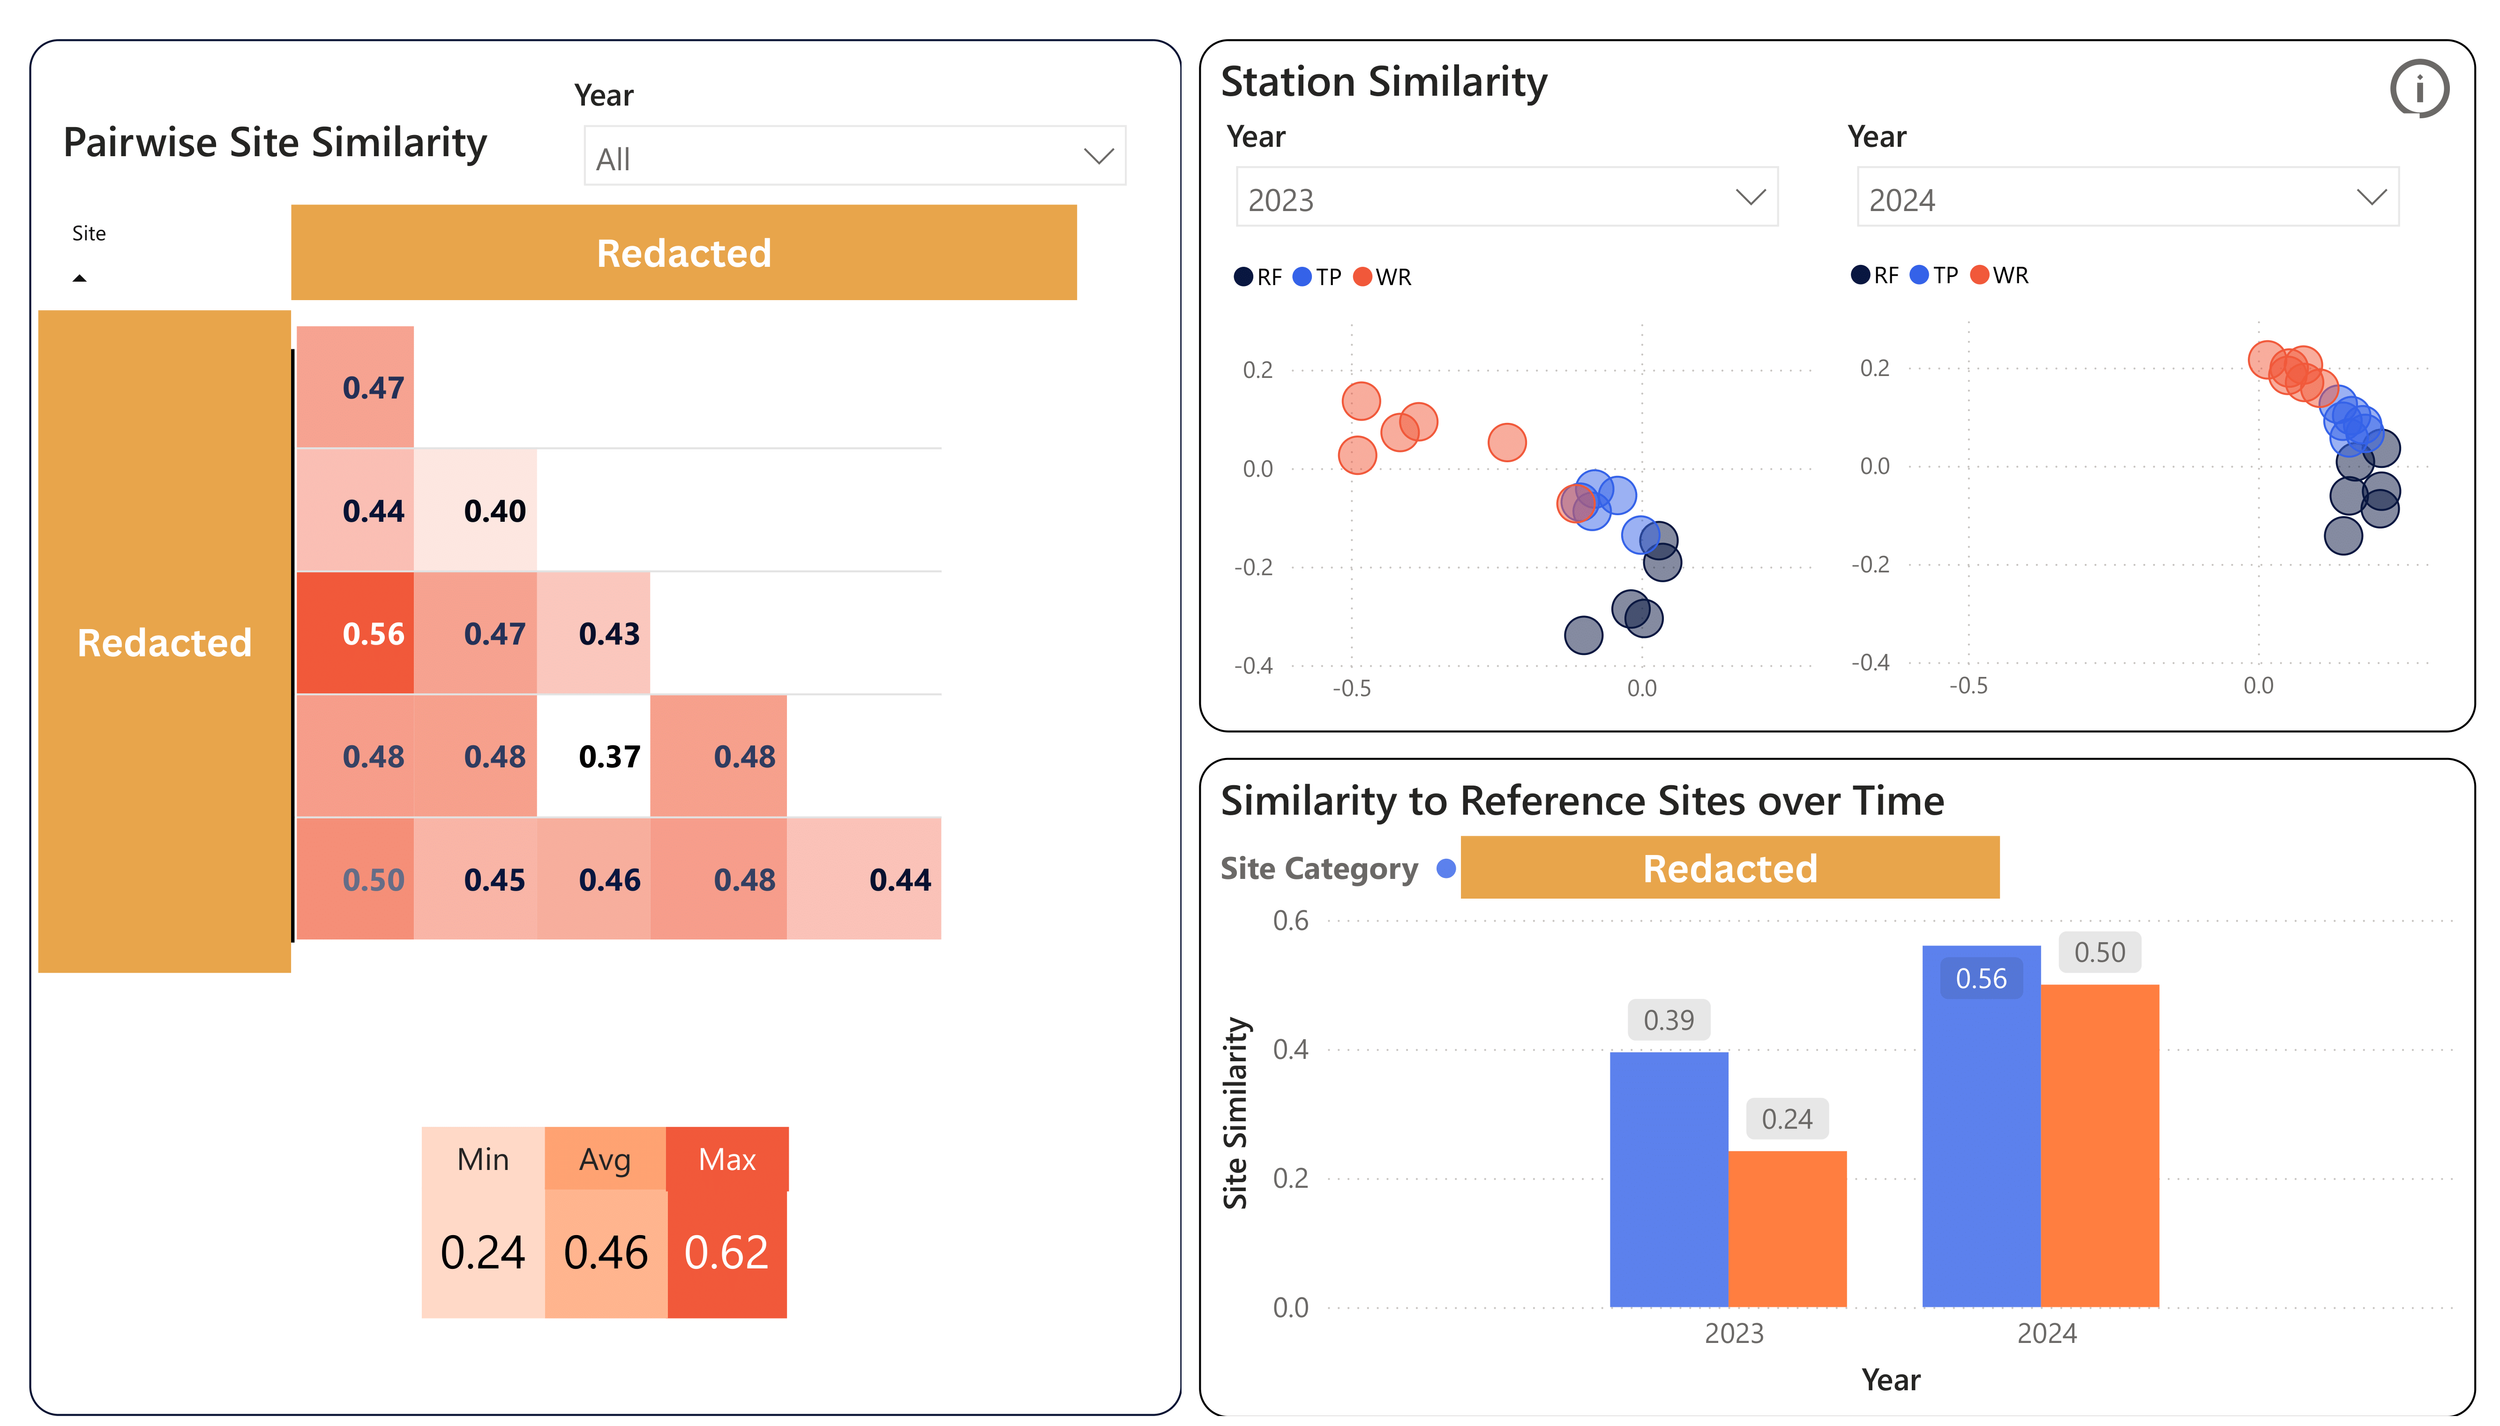
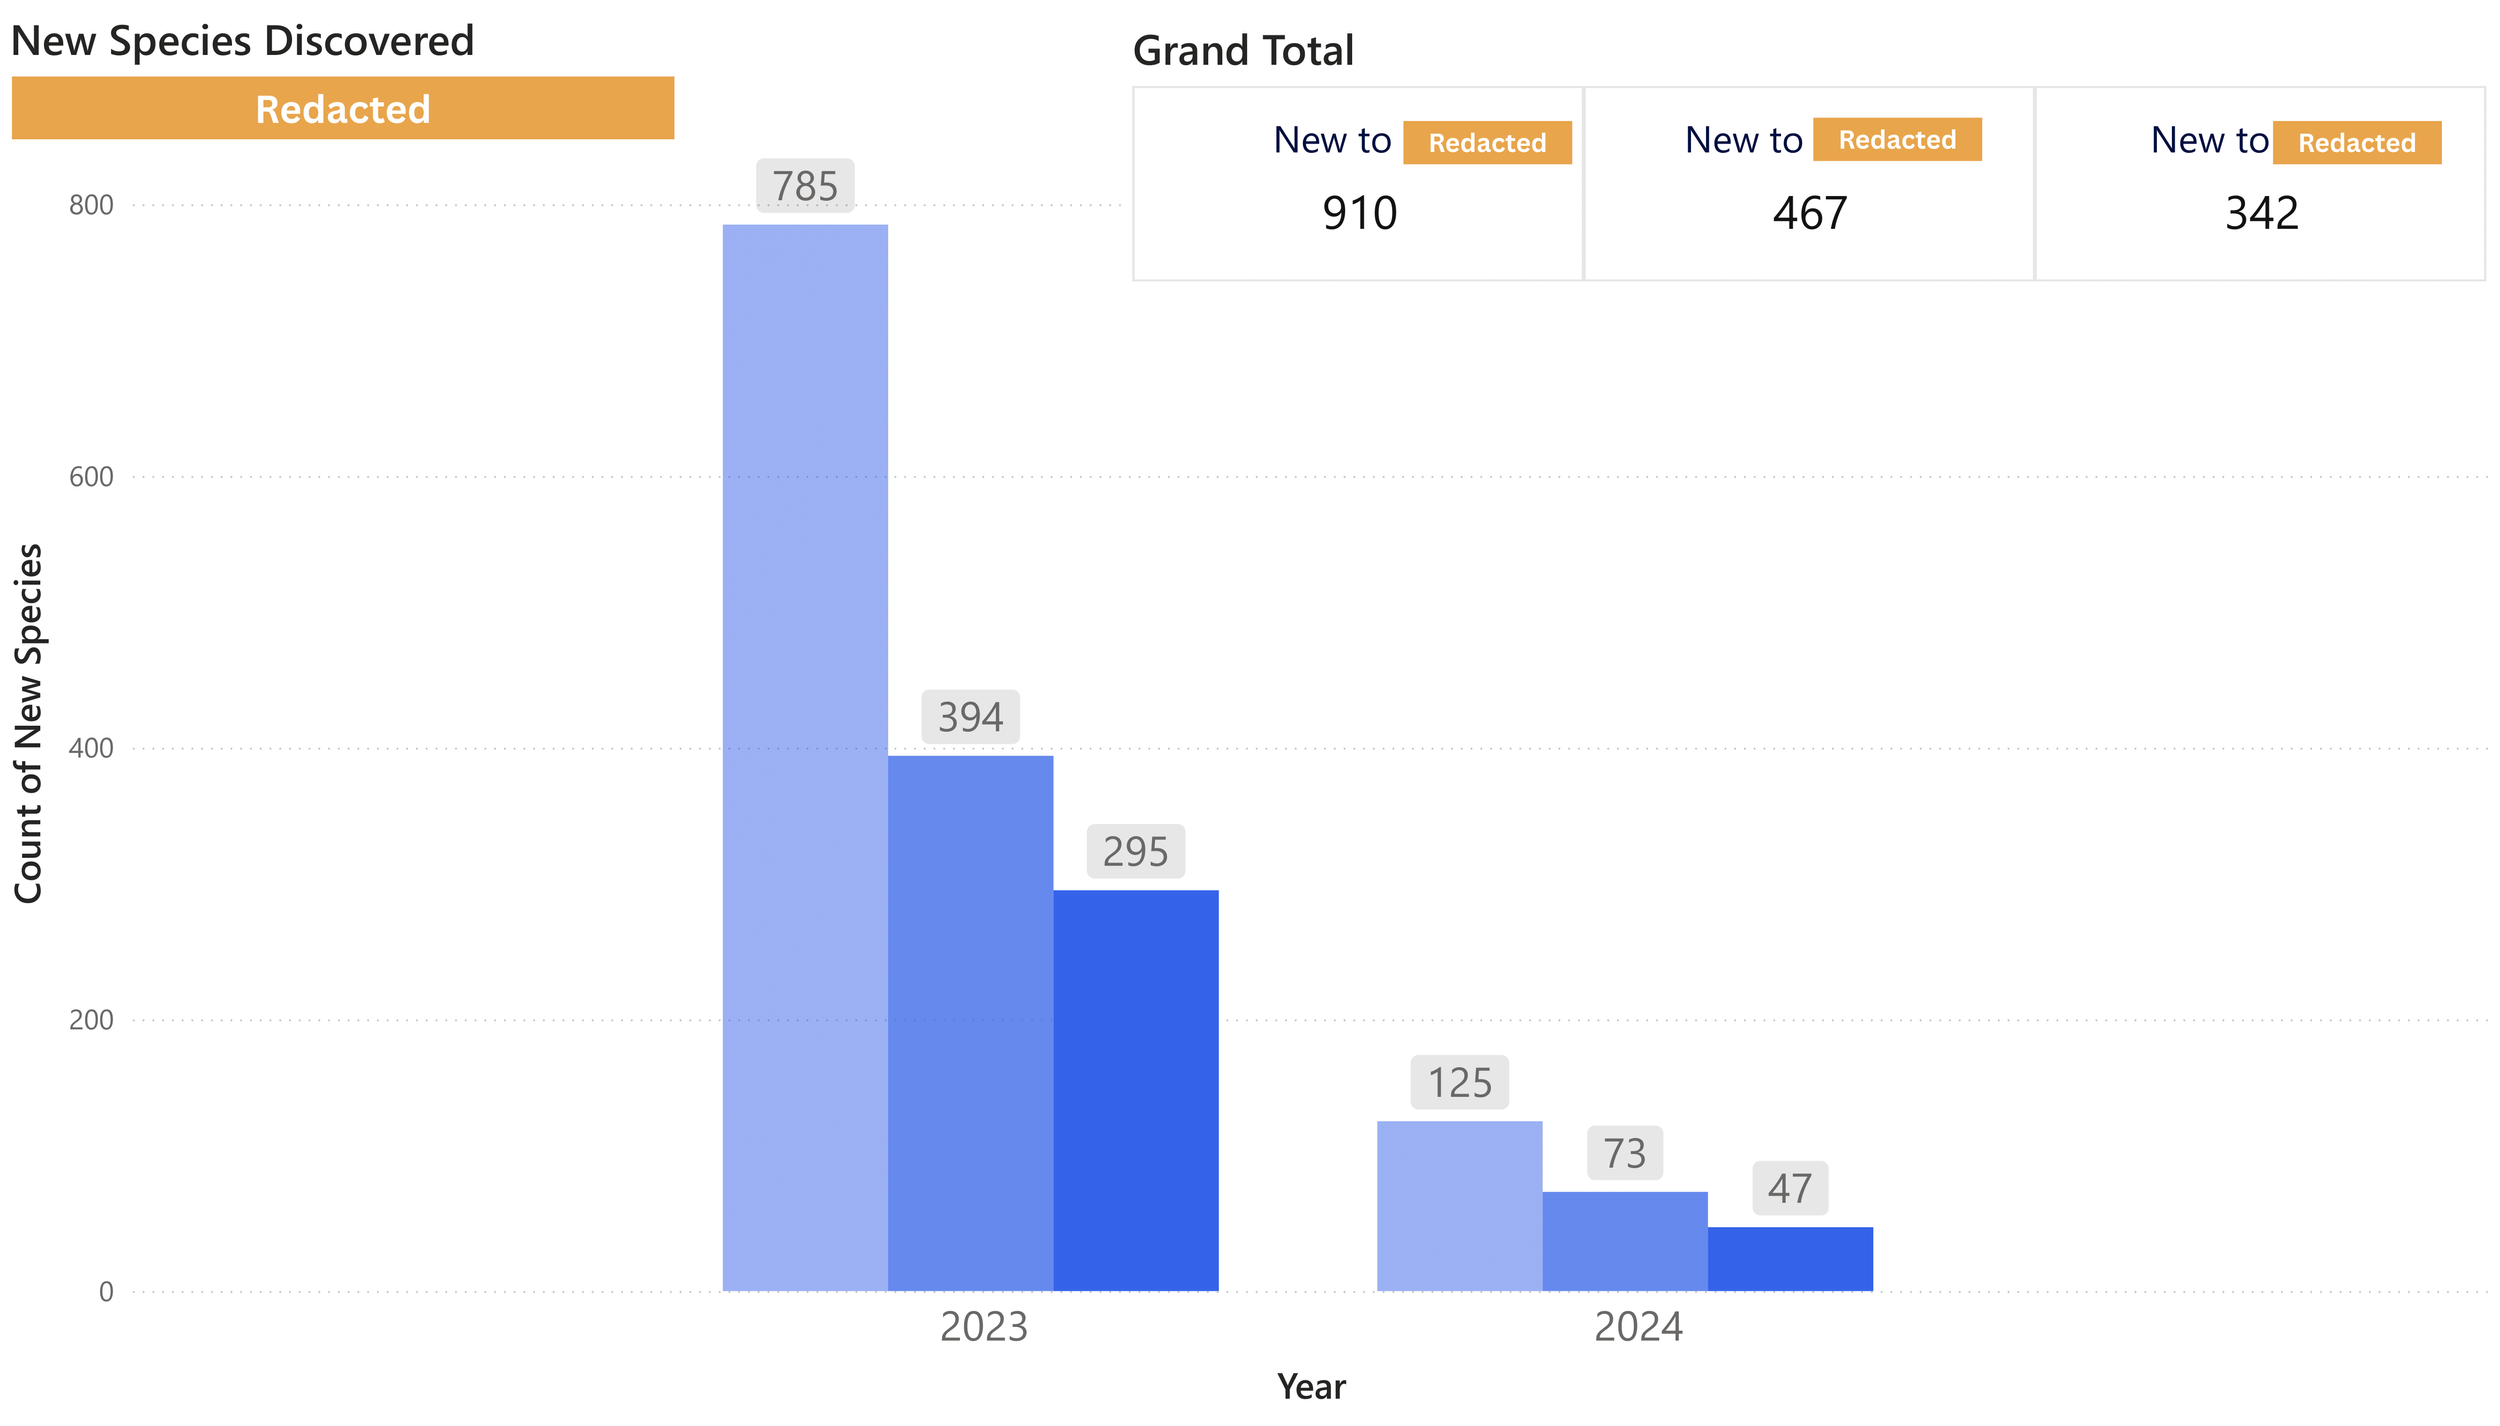
I designed and built a comprehensive PowerBI dashboard that turns this complexity into clear, actionable insight. It brings together multiple perspectives: high-level biodiversity trends, site-to-site comparisons, ecological recovery tracking, species richness and diversity metrics, taxonomic and functional group breakdowns, and the appearance of newly detected species.
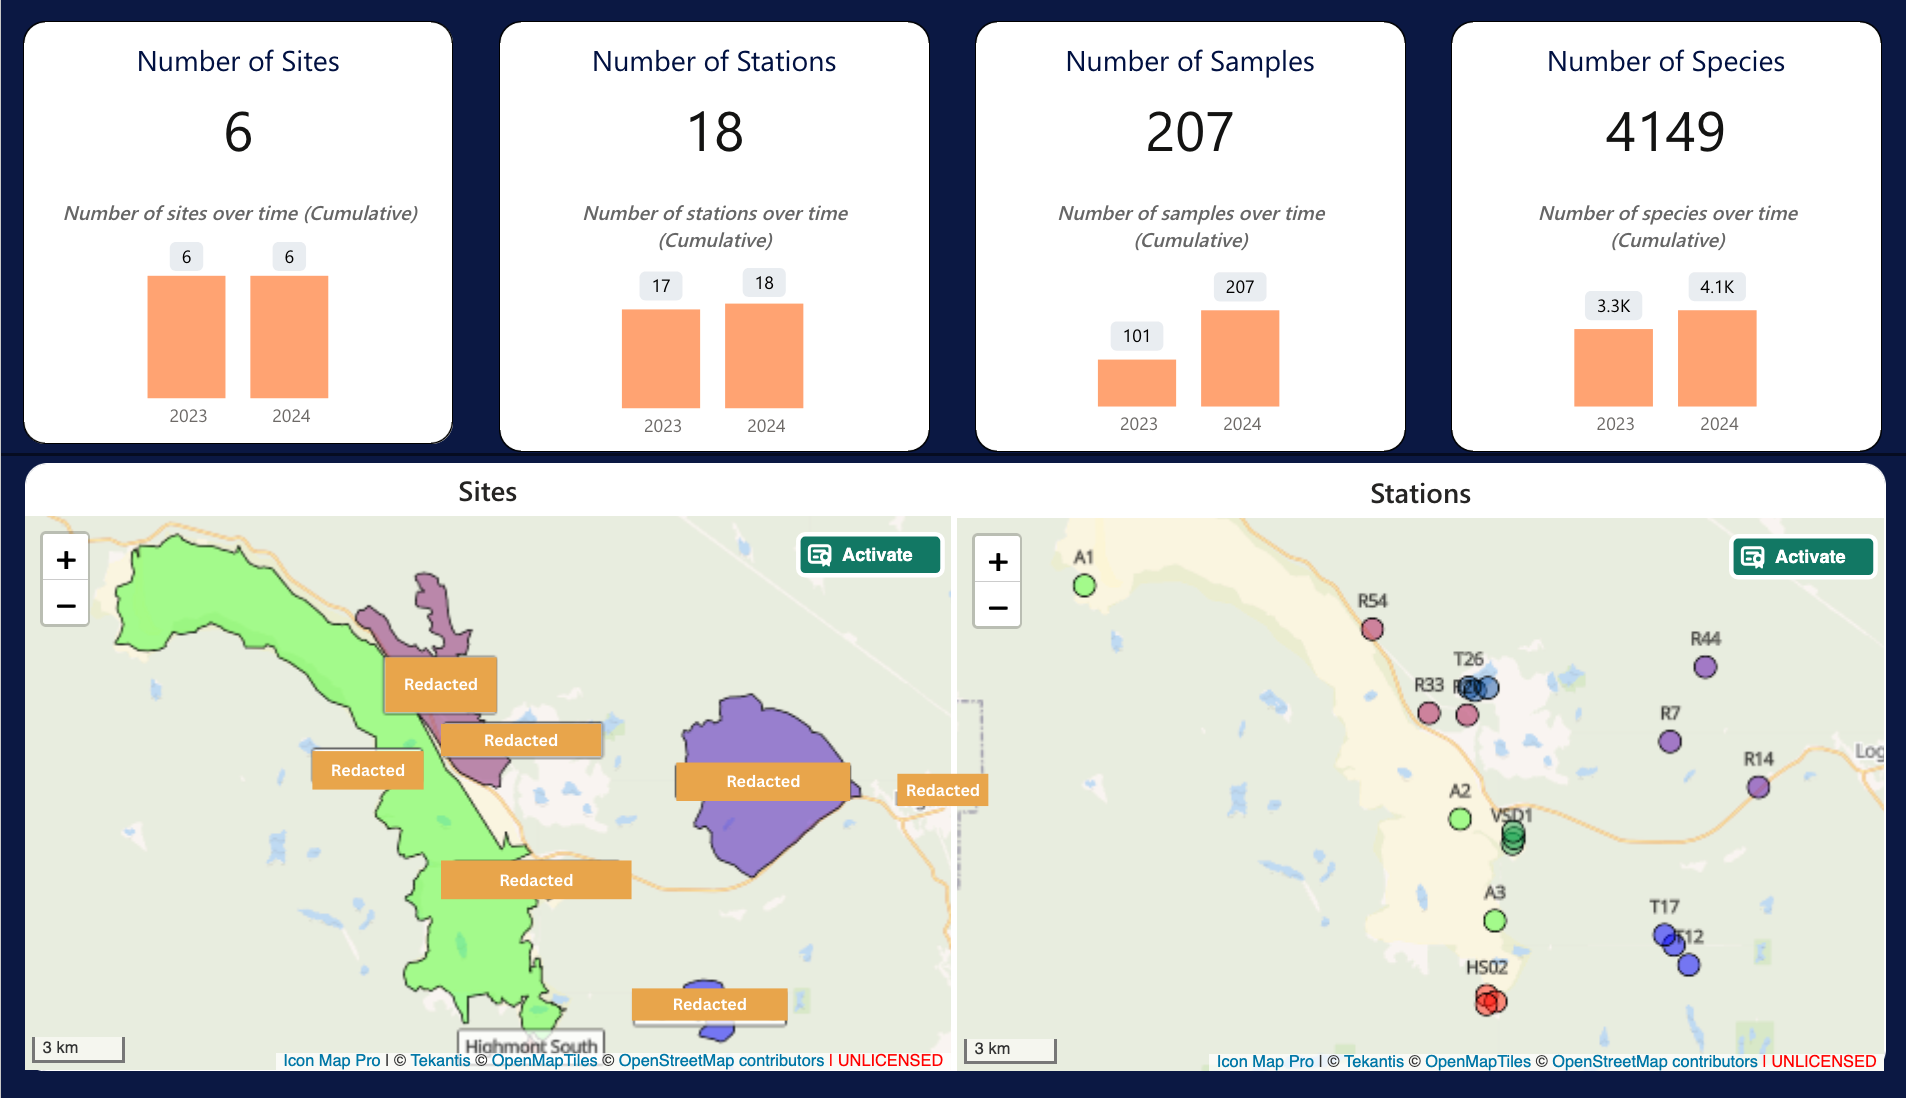
The dashboard continues to allow users to explore the data intuitively: filtering by site, year, or season and to instantly see how remediation areas are progressing against biodiversity targets. Today, it provides visibility across 6 sites, 18 stations, and more than 4,100 species from 207 samples, giving stakeholders a reliable foundation for evidence-based management and long-term ecological planning.
Please excuse all of the redactions in the images below, this project was confidential.
Overview
Sites & Stations
Site Similarity
New Species
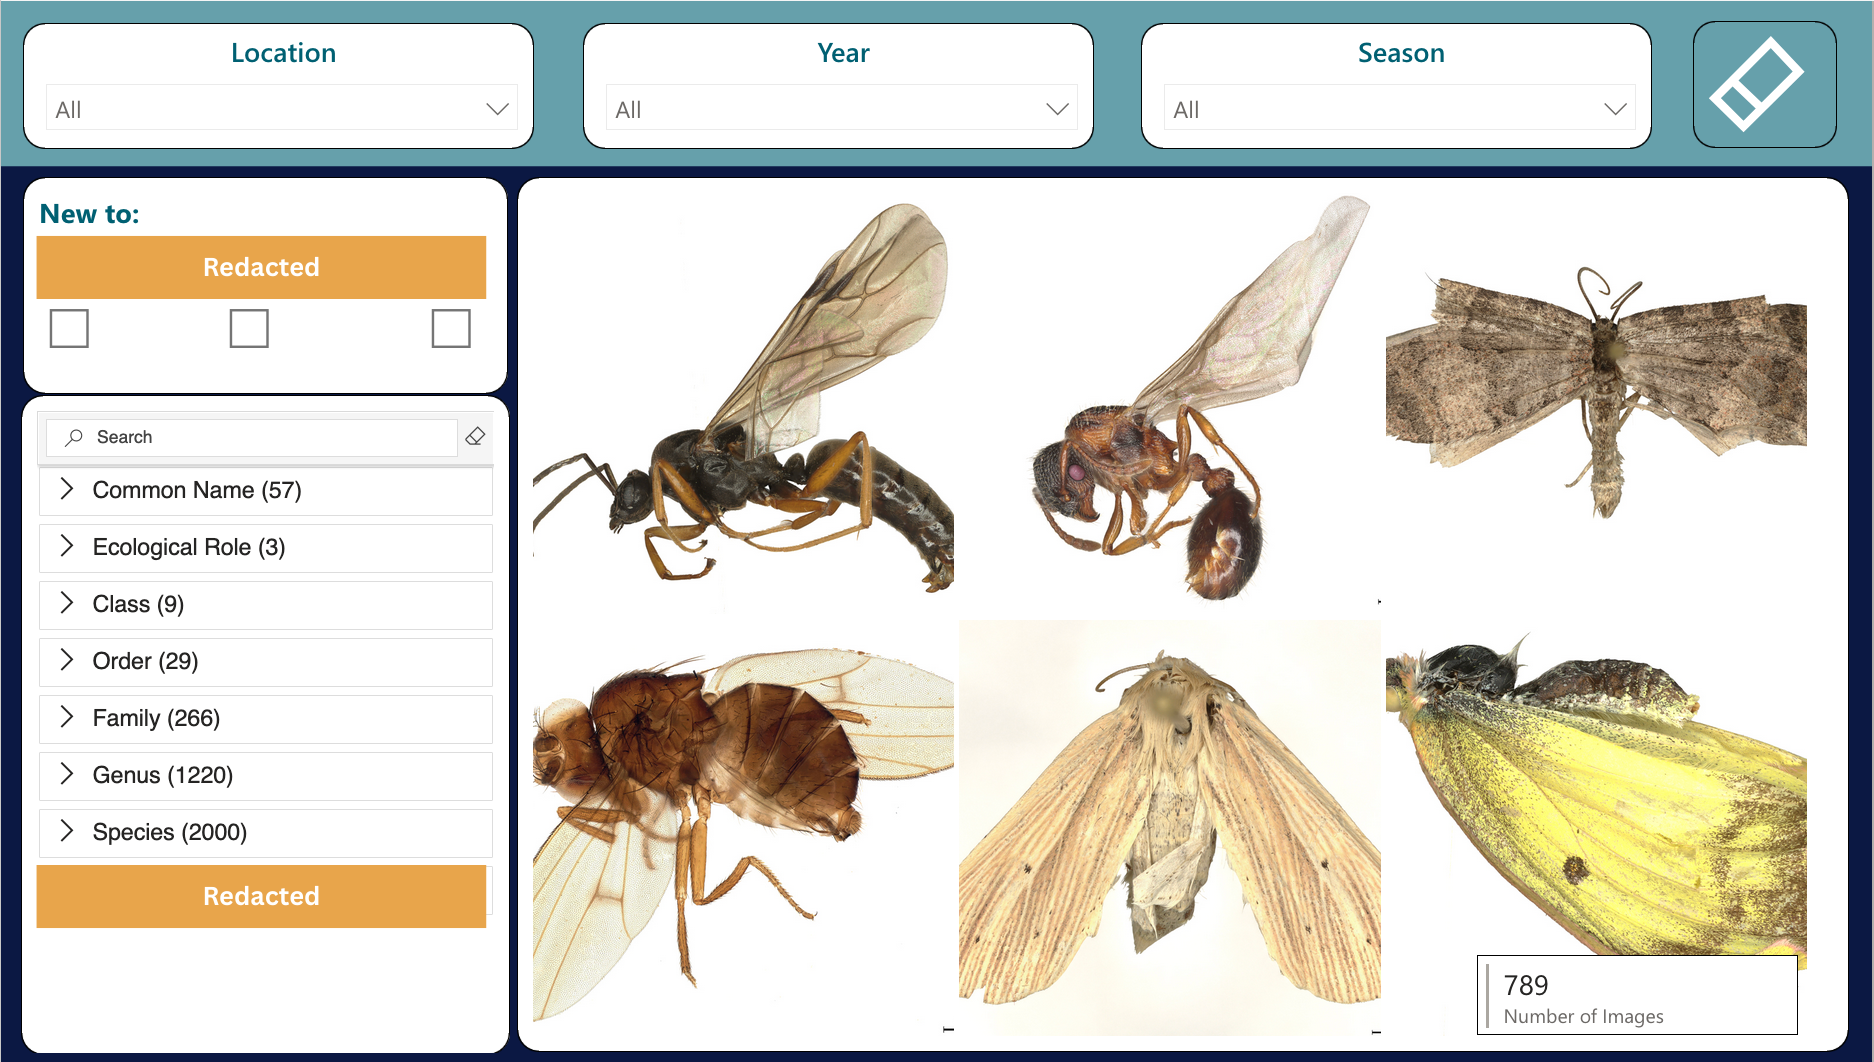
Images
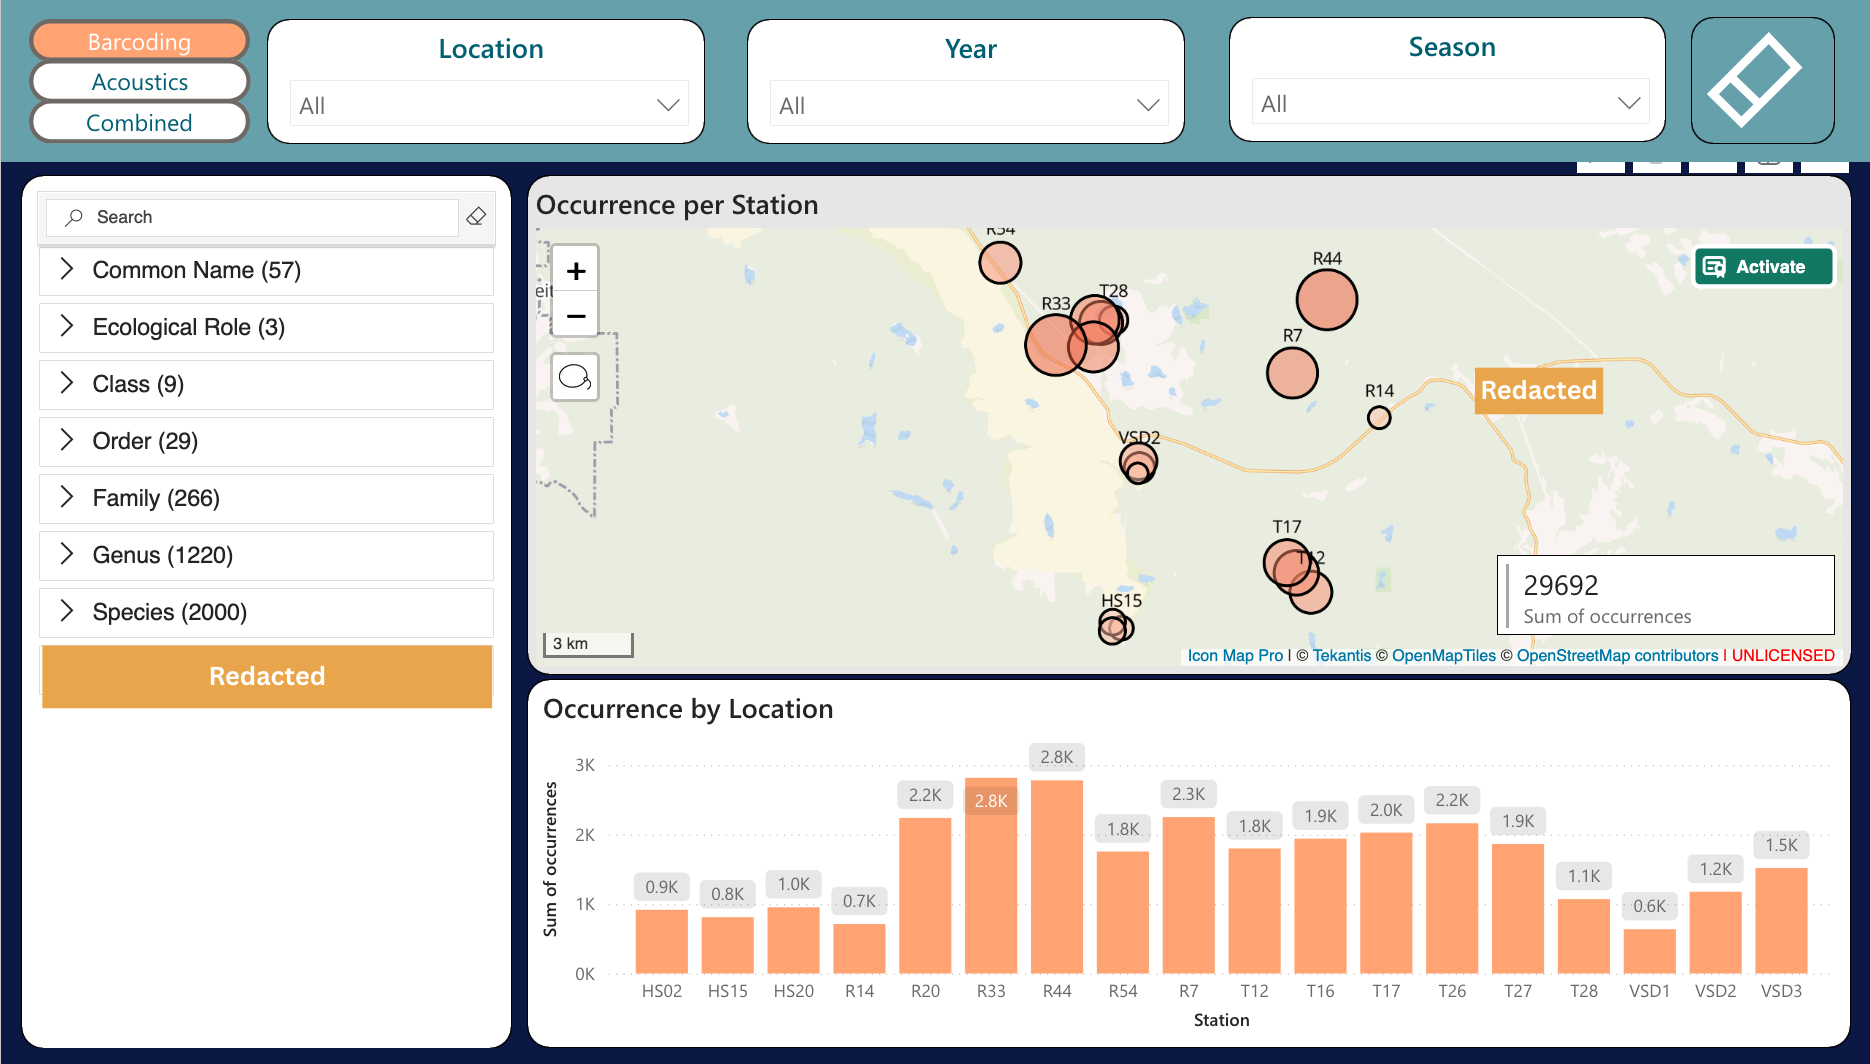
Occurrence
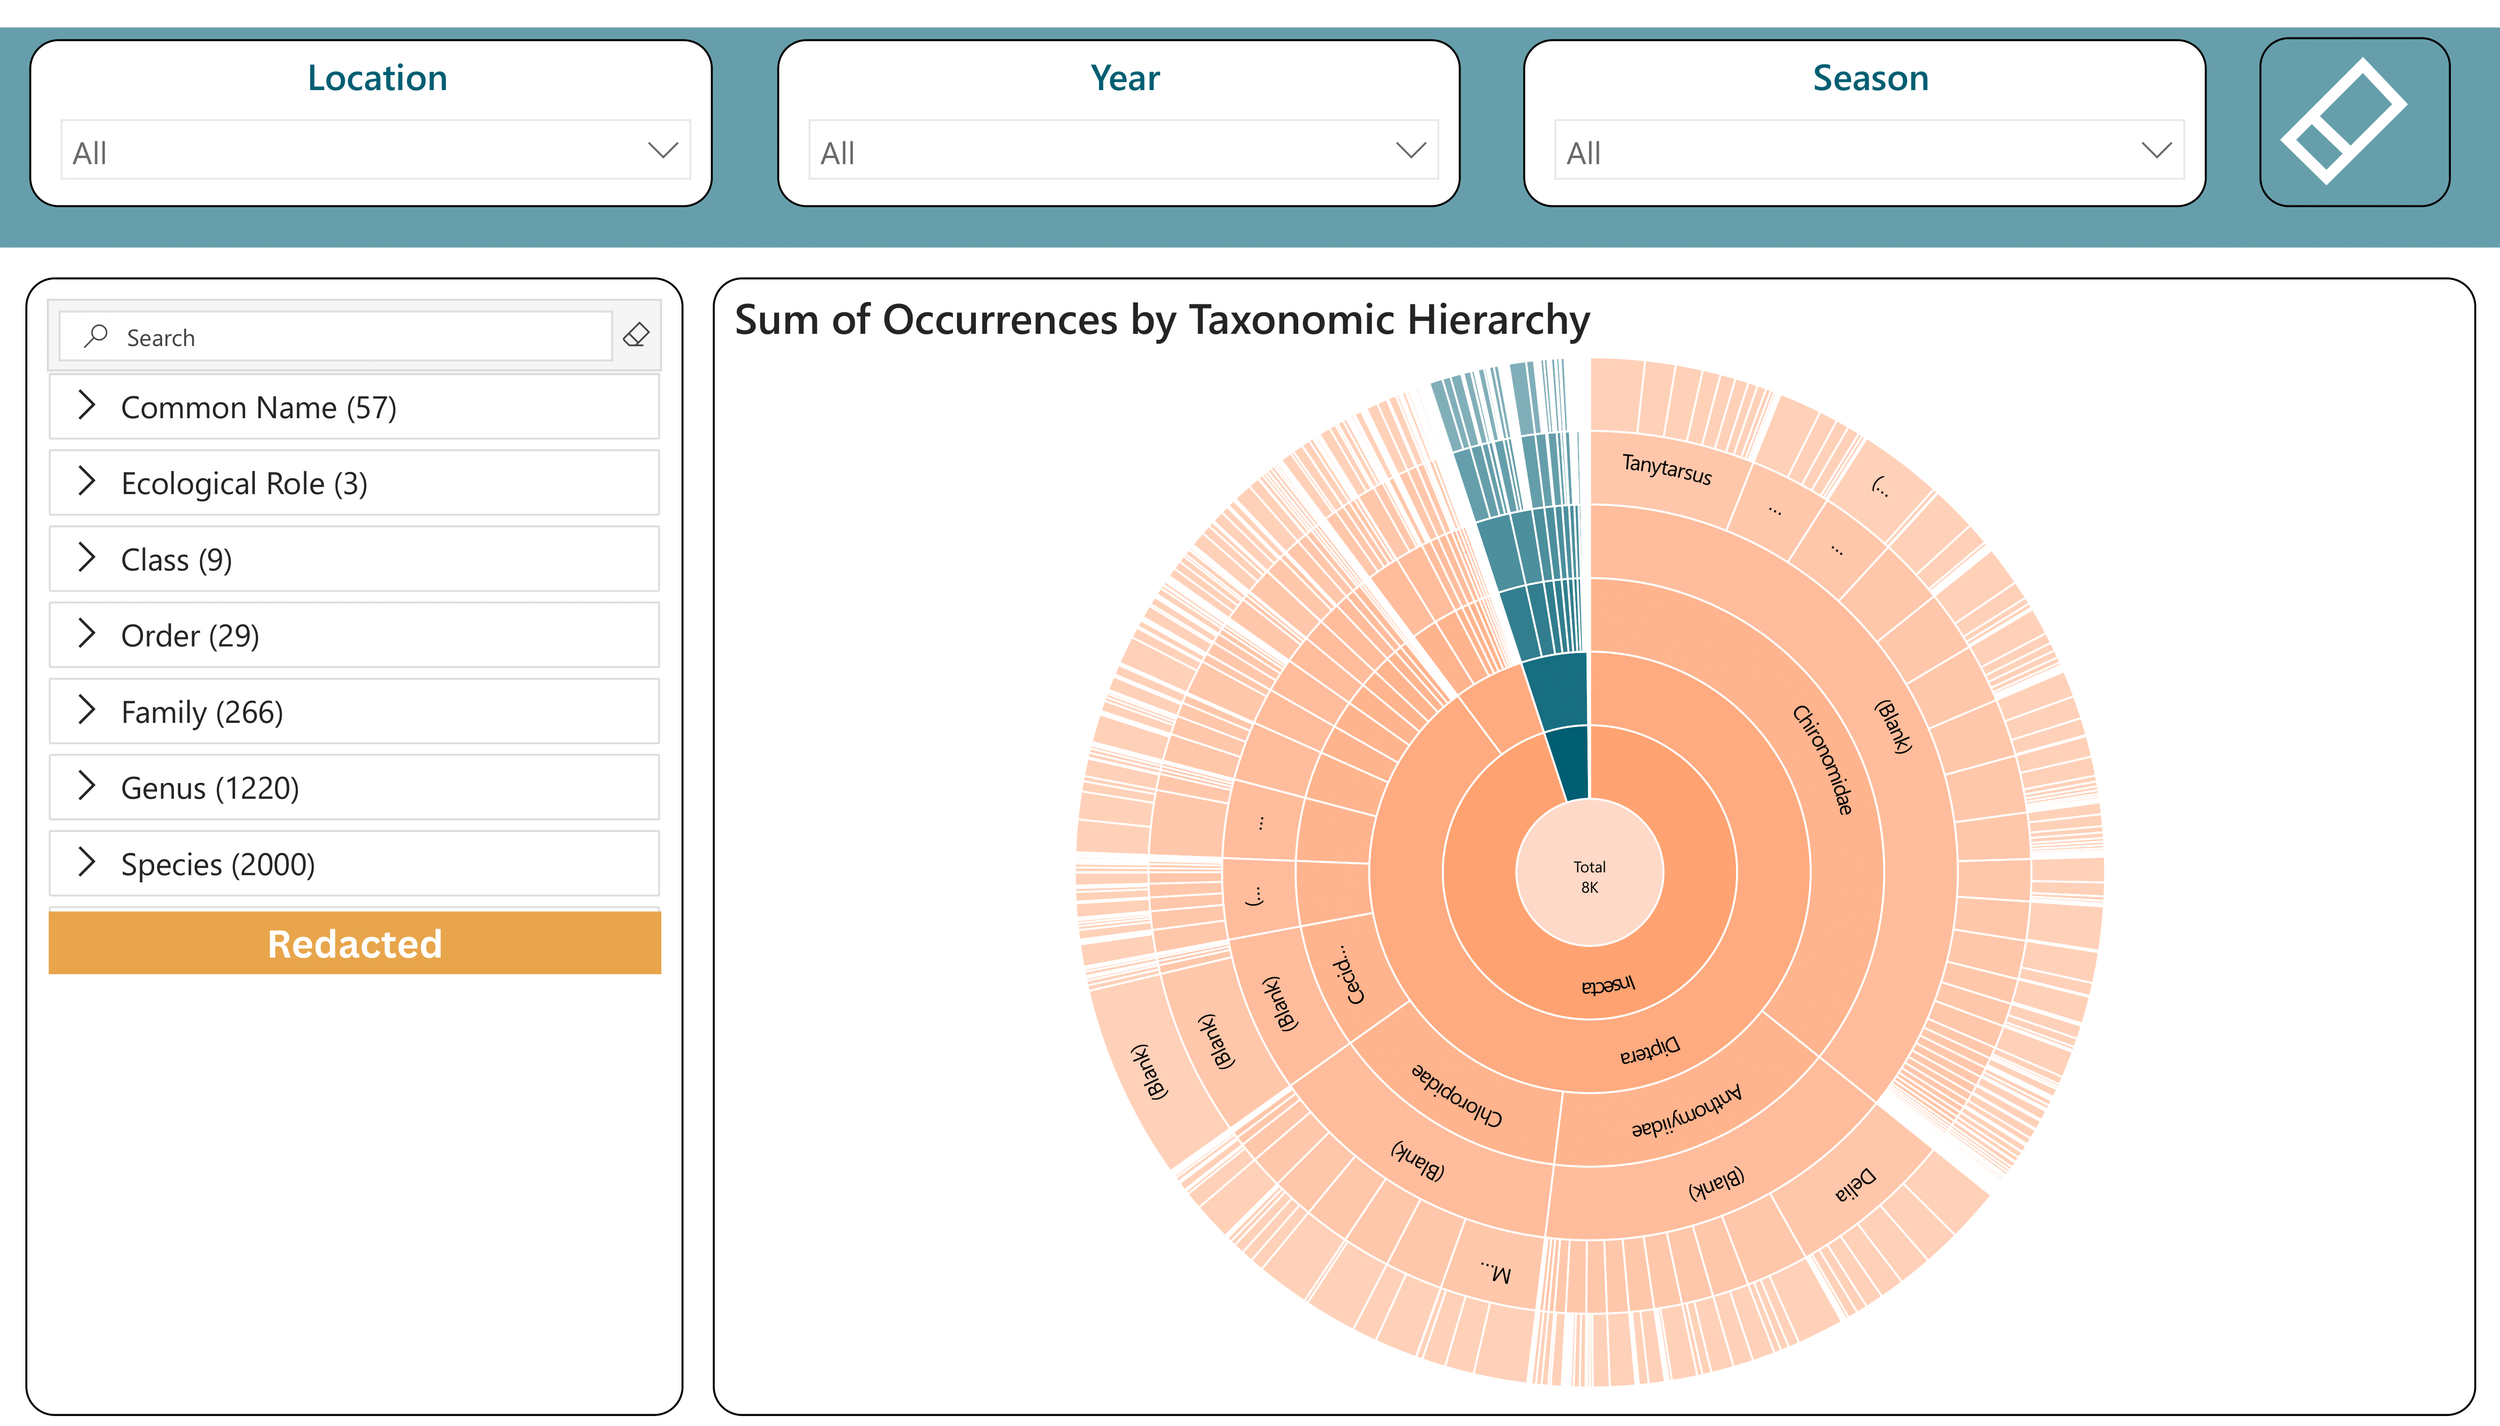
Taxonomic Composition
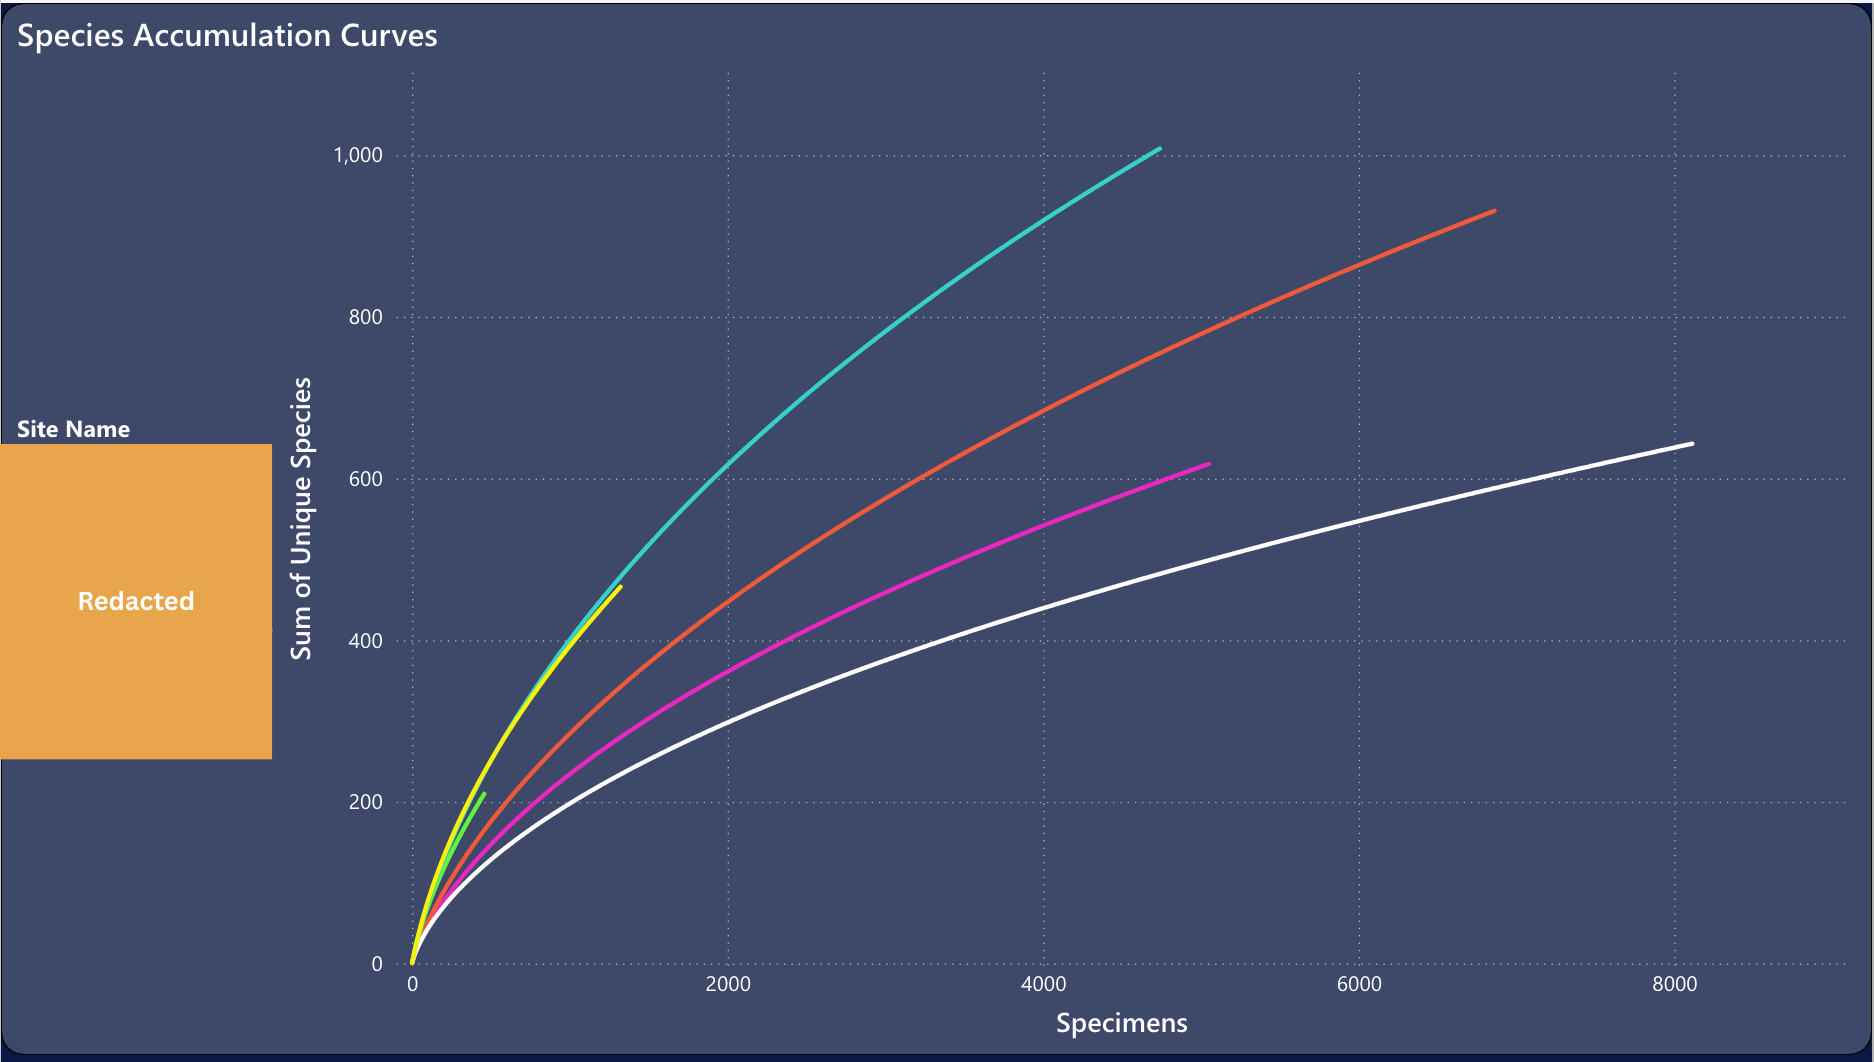
Accumulation Curves
Project Partners